Analyst Days 14 / Impulse 2022: Don't Paint the Grass — Data Risk and Value in a BANI World
A talk from Analyst Days 14 and Impulse 2022 — why ungoverned data turns into a ticking time bomb, and how DAMA, ISO 27000, and plain common sense help you avoid it.
5,000 Salespeople Who Never Went Anywhere
A large FMCG company, B2B segment. Several thousand sales reps. CRM, analytics dashboards, demand forecasting — the full package. Management looks at the territory-coverage charts and sees a pretty picture: client visits are climbing, activity is peaking.
One problem: some of those visits never happened.
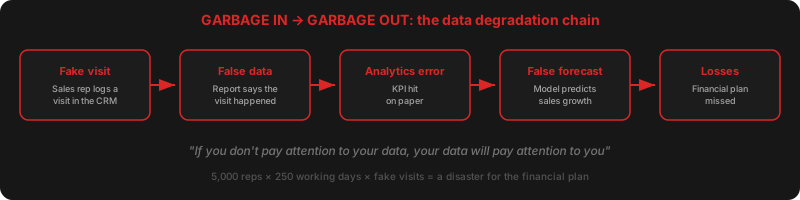
The reps spoofed their geolocation, copied reports from previous visits, and entered made-up notes about meetings. The system accepted all of it. The dashboard drew all of it. Sales forecasts were built on this data. Procurement plans were built on the forecasts. Production was built on the plans.
A fake sales visit → a false sales forecast → excess raw-material purchases → overproduction → a hole in the financial plan. Four steps from a lie in the CRM to a hole in the budget. GIGO — Garbage In, Garbage Out. A principle everyone knows and most people ignore.
I used this case at Analyst Days 14, Impulse 2022, and LAF 2022. And every single time, after the talk, people came up to me and said: "We have exactly the same thing, just wrapped differently."
Don't Paint the Grass
There's an old army joke. The commander says: "A general is coming tomorrow, the grounds must be green." So the soldiers paint the grass green. Technically, the requirement is met. In practice, it's idiocy.
Corporate data is the same story. You can write a data governance policy, hang it on the wall, and tick the box. That's painting the grass. Or you can build a process: assign owners, roll out quality control, automate checks, train people. That's planting a lawn.
The difference isn't obvious right away. Painted grass looks decent in a photo. But after the first rain, the paint washes off. A lawn, on the other hand, keeps growing.
This metaphor runs through the whole article. Every time you see a solution that looks great on a slide but doesn't work in real life — you know what it is. Paint on grass.
BANI: The World We Work In
VUCA is obsolete. Welcome to BANI — a more accurate model of reality.
| BANI | Meaning | What it means for data |
|---|---|---|
| Brittle | Systems break suddenly and cascade | One failure at the source collapses the entire reporting chain |
| Anxious | Uncertainty paralyzes decisions | Without quality data, managers decide on fear and gut feeling |
| Non-linear | Small input = huge output | An error in a reference table = millions in broken reports |
| Incomprehensible | We don't understand why it happens | System complexity exceeds any human's ability to trace it |
This isn't a trendy acronym for slide decks. In a BANI world, data quality is a matter of business survival. Not "nice to have," but "without it, you're blind."
Non-linearity is the most dangerous property. In the FMCG case, one rep's error is trivial. A thousand reps' errors, amplified through a forecasting model, are a catastrophe. The system doesn't degrade gracefully. It works fine, fine, fine — and then the whole thing breaks at once.
A Case from Banking: When a Reference Table Kills Your Reporting
FMCG is someone else's turf. Let me tell you about mine.
On a banking project, we ran into a textbook problem: reference tables that didn't agree across systems. The same client is "Romashka LLC" in the CRM, "LLC Romashka" in the core banking system, and two different clients in the analytics warehouse. Because the ETL process matched on an exact name match.
The scale of the problem became visible when the business asked for a cross-sell report. How many clients who took out a loan also have a checking account? The answer according to the data: 40%. The answer in reality: 65%. The gap — a quarter of the client base that the system failed to stitch together.
Forecasts were built on that 40%, marketing campaigns were planned, budgets were allocated. Painted grass. Pretty numbers on a dashboard, with garbage behind them.
We fixed it with a graph platform: we built a system that matches entities not by exact match but by a combination of attributes — tax ID, address, phone, transaction patterns. (More on how we built a data-intensive platform at a bank.) But it took months. And the damage from broken reports had been piling up for years.
The Framework: How Not to Paint the Grass
Data Classification and ISO 27000
The first step is to understand what data you have and how critical it is. Public, internal, confidential, secret. It sounds bureaucratic, but without it you can't set priorities.
ISO 27000 gives you a frame: what data we store, who has access, what happens in a breach, which regulatory requirements we comply with. You don't have to get certified — it's enough to use it as a checklist.
DAMA: Ten Data Management Areas
DAMA International organized data management into ten areas. Not a theoretical construct — a practical framework. Here it is in condensed form:
| Area | The gist | Red flag (you're painting the grass if...) |
|---|---|---|
| Data Governance | Roles, responsibilities, policies | ...the policy exists, but nobody knows who the data owner is |
| Data Architecture | Where each kind of data lives | ...the architecture was drawn a year ago and never updated |
| Data Security | Protection from unauthorized access | ...every analyst has access to every table "for convenience" |
| Data Modeling | Conceptual, logical, physical models | ...the data model lives in one person's head |
| Data Storage | Storage, retention, archiving | ...nobody knows how much data is stored or why |
| Master Data | Golden records with no duplicates | ...one client lives in five systems as five different records |
| Data Integration | Flows between systems | ...the ETL was written 5 years ago and the author quit |
| Data Quality | Completeness, accuracy, freshness | ...there's not a single data quality metric |
| Metadata | Data about data, lineage | ...a flag_3 column in a temp_data_final_v2 table |
| DWH & BI | Analytics and visualization | ...the dashboard exists, but nobody trusts its numbers |
No company covers all ten perfectly. But knowing where you stand on each scale is already half the solution. And if you recognized your own company in the "red flag" column three or more times — you don't have a data problem. You have a ticking time bomb.
Exponential Growth: Why Tomorrow Will Be Worse
Data volume grows exponentially. Every year produces more than all the previous years combined. Companies generate data faster than they can process it. Managing its quality — don't even get me started.
The typical enterprise picture: dozens of data sources, each with its own format. Reference tables get duplicated across systems and drift apart a month after syncing. Master data lives in an Excel file on a manager's desktop. ETL processes were written five years ago and the author quit long ago.
A concrete example from a banking context: over two years of working on a data platform, the volume of data in the analytics warehouse grew several times over. Not because the business grew — but because we kept connecting new sources, adding history, and storing intermediate calculations. Meanwhile, the number of people responsible for the quality of that data didn't grow at all: one and a half analysts and a DBA for whom this was the fifth item on his task list. Data grew exponentially; the resources to manage it grew linearly, at best.
The problem isn't the technology. Data management technology has been around for ages. The problem is the organization: no owners, no policies, no processes. The data belongs to no one. And what belongs to no one is needed by no one. Until it blows up.
Checklist: A Lawn Instead of Paint
If after reading this you want to check whether you're painting the grass — here's the minimum.
-
Do you know what data you have and who's responsible for it? If not — start with an inventory. You don't need perfect cataloging — you need at least a list of critical sources with the names of the people who own them.
-
Do you have data quality metrics? Completeness, freshness, consistency. If not — you don't know how much you can trust your reports. You're making decisions on faith, not on data.
-
Does your master data live in one place, or across five Excel files? If it's the latter — you're painting the grass. You have no single source of truth, which means every department has its own truth.
-
When was the last time anyone checked the ETL processes? If the answer is "no one remembers" — that's a landmine under your reporting. An ETL that no one monitors will sooner or later start silently losing or distorting data.
-
What happens when a data source goes down? If the answer is "we find out when the business complains about a report" — you're reactive. And in a BANI world, reactivity = losses.
-
Can your analysts actually work with data hands-on? If not — reread my article on the path of data. You don't have analysts, you have dashboard doodlers.
-
Do you have data lineage — even on a napkin? Can you answer, in five minutes, where the number in a specific report cell comes from? Which systems it passed through, which transformations it went through, when it was last refreshed? If not — you don't know what to trust. I've seen a situation where two reports for the very same business stakeholder showed different numbers for the same metric — simply because one pulled data from a replica with a day's lag and the other from the live database. Both were "correct." Both were lying.
Don't Paint the Grass. Plant a Lawn.
In a BANI world, data is the only foundation for decision-making. If the foundation is rotten — everything built on it collapses. And it collapses not gradually, but all at once. Because BANI.
I've seen fake visits from five thousand salespeople turn into a hole in the financial plan. I've seen unmatched reference tables kill cross-sell analytics. I've seen ETL quietly turn ordinary clients into VIPs. Every time, the cause is the same: someone, somewhere, painted the grass instead of planting a lawn.
A lawn is boring. A lawn is data governance, quality metrics, data owners, ETL monitoring, master data management. It doesn't sparkle on slides. It doesn't impress in a meeting. But after the first rain — and it will come — the lawn is still standing. And the paint washes off.
Based on a talk given at Analyst Days 14 / Impulse 2022.
Yours, DPUPP
Related Articles
How to Take a Banking Product Real-Time
Building a real-time pre-approved offers system inside a banking enterprise. Apache Flink, Tarantool, Kafka — and the lessons you won't find in the docs.
Fintech Development: 7 Circles of Hell
An honest guide to what awaits your team when shipping a product to production at a major bank. From hiring to support — every stage is a challenge of its own.
Saint HighLoad++ 2024: Moving a Banking Product to Real-Time
A talk from Saint HighLoad++ 2024 — how we built a real-time trigger system for banking customers on Apache Flink, Tarantool, and Kafka, and what did not go according to plan.