Analyst Days 15: Behold the Path of Data, Padawan
A talk from Analyst Days 15 — data as the circulatory system of a business. The three states of data, the patterns for working with it, and why an analyst who does not understand data is not an analyst.
An analyst who doesn't work with data is not an analyst
April 2023, Moscow, Analyst Days 15. A room of about two hundred people, the third talk after lunch — the slot where the audience usually nods off into their phones. I walk on stage and open with my first slide: "An analyst who doesn't work with data hands-on is not an analyst." Half a second of silence. Then — a murmur. A few people in the front rows nod. Someone in the back rows turns red and crosses their arms. I see a woman in the third row open Telegram — probably already firing off an outraged post in the conference chat. Which means I hit a nerve. Which means I can keep going.
Let me repeat that thesis here, up front, so it's clear right away: this isn't a motivational piece about "data is the new oil." This is a conversation about what you're obligated to know how to do if you call yourself an analyst.
An analyst isn't someone who draws diagrams in Miro and writes user stories in Jira. An analyst is someone who understands data. Who can read a SQL query and know what it does. Who can open a log and spot an anomaly. Who knows the difference between a LEFT JOIN and an INNER JOIN not by the textbook definition, but by its effect on a business report — when one returns 10,000 rows and the other 8,500, and those missing 1,500 are the customers with no transactions that you silently dropped from your analysis.
If you don't work with data hands-on, you're a manager who talks about data in words. That's a different profession. It's needed too. But it isn't analysis.
After the talk, a guy of about twenty-five came up to me, introduced himself as a systems analyst from fintech, and asked: "Wait, you actually need to know SQL? We have data engineers for that." I answered with a question: "And when the data engineer is on vacation and the business urgently asks you to verify a number in a report — what do you do? Wait?" He went quiet. That pause right there is why it's worth getting on stage.
Keep that thought in mind — it's the leitmotif of everything below.
IT as a circulatory system
Business loves metaphors. Data-driven, digital transformation, AI-first — pretty words on strategy slides. But behind each of them is one simple thing: data has to flow. From point A to point B, in the right format, at the right time, with the right quality.
IT systems are the circulatory system of the business organism. Data is the blood. If there's a clot somewhere, that part dies off. If the blood is contaminated, the whole organism suffers. The metaphor is banal, but I've never come across a more accurate one.
On a project at VTB I felt this literally. We were building a personalized-offers system for customers — in batch mode at the time, but even then we were laying the foundation for what later became a real-time engine. If data about a customer arrives with a delay, the offer is already irrelevant. If the data is dirty, the offer isn't just irrelevant — it's insulting. Picture it: a customer has just paid off a loan and receives an SMS offering to refinance it. A clot in the circulatory system.
Three states of matter
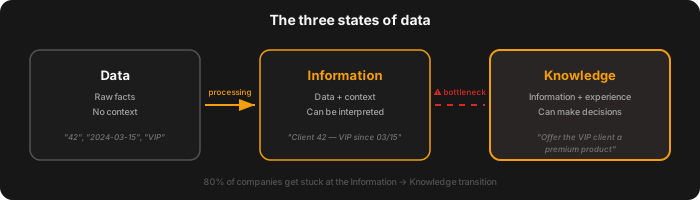
Data exists in three states, and the transitions between them are the essence of what any IT system does. In short: logs and clicks → signals and metrics → grounds for decisions.
Data — raw material. Logs, transactions, sensor signals, clicks. The log line user_id=12345, action=click, timestamp=1681548000 means nothing out of context.
Information — data in context. When you know that user_id=12345 is a VIP customer, action=click is a click on the "close account" button, and the timestamp is 10 minutes after a failed support call, that log line turns into an alarm signal.
Knowledge — information backed by experience and patterns. You know that over the last quarter, 40% of the customers who clicked "close account" after a support call actually left. And you know that retention costs five times less than acquisition. Now you don't have a signal — you have grounds for action.
The transition from Data to Information requires structure and context. The transition from Information to Knowledge requires analysis and expertise. Most companies get stuck on the first transition, accumulating terabytes of data that will never become information.
Four roles — one table
The same database table looks completely different depending on who's looking at it.
| Role | Sees | Key question | Thinks in terms of |
|---|---|---|---|
| Analyst | Business entities | "What does the data mean for the business?" | Relationships, patterns |
| Developer | Structures, indexes | "How do I write/read this efficiently?" | Performance |
| Tester | Edge cases | "What breaks on bad data?" | Failures, exceptions |
| DevOps | Flows, volumes | "Is the data even arriving?" | Infrastructure |
A dry table. Let me fill it with life.
One example: a transactions table
Take transactions — a standard table in a banking system. Fields: id, client_id, amount, currency, timestamp, status, merchant_id, category.
The analyst looks and thinks: "The average ticket in the groceries category grew 12% in Q3. Is that inflation or a change in behavior? I need to cross-tabulate with client_segment and see who exactly started spending more." They see a business story in the numbers.
The developer looks and thinks: "A query with a JOIN on merchants and a GROUP BY on category over a quarter is a full scan of the whole table. We need a partition on timestamp and a composite index (category, timestamp). Otherwise the dashboard will take minutes to load." They see performance.
The tester looks and thinks: "What if amount is negative? What if currency = NULL? What if timestamp is in the future? What if status = 'pending' has been that way for three days?" They see everything that can break.
DevOps looks and thinks: "The table grows every day — in a couple of months we'll hit the disk-space ceiling. Replication is lagging — for a real-time dashboard that's critical." They see infrastructure.
One table — four worlds. The trouble starts when those worlds don't intersect. The analyst designs the model without thinking about performance. The developer optimizes queries without understanding the business meaning. The tester checks formats without knowing which data is critical. DevOps monitors availability without seeing that the data is flowing but already invalid.
A strong team is one where everyone understands at least the basics of the others' perspective.
When data lies: a story from the banking world
Early 2022. We're launching a new personalized-offers module. Everything's tested, everything's polished. First week in prod — the metrics look beautiful. Conversion is growing. Management is happy.
Second week — an anomaly. One of the customer segments shows conversion three times higher than expected. Sounds like a win? That's what we thought too. For about thirty seconds.
Then we dug into the data. It turned out the ETL process that loads customer segments, on a parsing error, silently assigned the default segment — "VIP." Silently. No errors in the logs, no alerts. It just quietly turned ordinary customers into VIPs.
The result: some customers got VIP offers they weren't entitled to. A few of them managed to use them. The rollback took a week, the post-mortem another two. I won't state the financial damage out loud, but it wasn't measured in thousands.
The moral: data doesn't lie. Data is whatever got written into it. What lies is the processes that handle that data. (More on risk and data management in the talk about the BANI world.) And if you, the analyst, don't understand how the data got into the table, you can't interpret what's sitting in it.
Four patterns: a map of the territory
Over years of working with data-intensive systems, I've come to single out four fundamental patterns. This isn't theory — it's daily reality.
Storage. Where the data lives, for how long, in what format. Relational databases, document stores, data lakes, in-memory caches. The choice of storage determines 80% of the architectural decisions further down the chain. A mistake here is the most expensive one.
Processing. Batch or stream, ETL or ELT, SQL or code. Each approach has its niche: batch for period analytics, stream for real-time reaction, and when you need both at once — a hybrid like Lambda or Kappa. Stretching batch over a real-time task is a classic anti-pattern I've seen in at least five projects. It ends the same way every time: a rewrite from scratch.
Transfer. APIs, message queues, file exchange, replication. Every seam between systems is a potential point of failure. In enterprise integration it's the main source of pain. We have dozens of integration flows on the project, and every one of them has broken at least once at the most inconvenient moment.
Documentation. Metadata, data lineage, data catalogs, data contracts. Without documentation, data turns into a black box. Six months later nobody remembers what the flag_3 field means in the temp_data_final_v2 table. I'm not joking — I've seen tables like that. In production. In a bank.
The thesis we started with
An analyst who works with data poorly is not an analyst. I started with this and I'll end with it, just harder.
The market is full of people who call themselves analysts and yet can't write a SQL query more complex than SELECT * FROM. Who don't know what an index is. Who don't understand the difference between batch and stream. Who draw beautiful diagrams but can't explain where the numbers on the dashboard came from.
These aren't analysts. These are people who talk about data. The difference is like the one between a surgeon and someone who watched a video of the surgery on YouTube.
If you're an analyst, figure out how data is stored, processed, transferred, and documented. Learn to read SQL. Learn to find anomalies in the data by hand, not just through a ready-made dashboard. Understand how an ETL process can silently turn your data into garbage.
The path of data isn't a conference abstraction. It's what you stand on every day. And if you don't know what's under your feet, sooner or later you'll fall through.
Based on my talk at Analyst Days 15, 2023.
Yours, DPUPP
Related Articles
AI in Development: 30-60% Acceleration — Reality or Hype?
Hands-on experience with AI tools and LLM agents in enterprise development and pet projects. Where AI actually speeds things up, where it creates an illusion, and how to build it into your process.
API From A to Z: Theory and Practice
API horror stories from banking development, a protocol comparison, and the mistakes I've seen in every other specification. Material from a systems analysis course.
Analyst Days 15: Behold the Path of Data, Padawan
A talk from Analyst Days 15 — data as the circulatory system of a business. The three states of data, the patterns for working with it, and why an analyst who does not understand data is not an analyst.